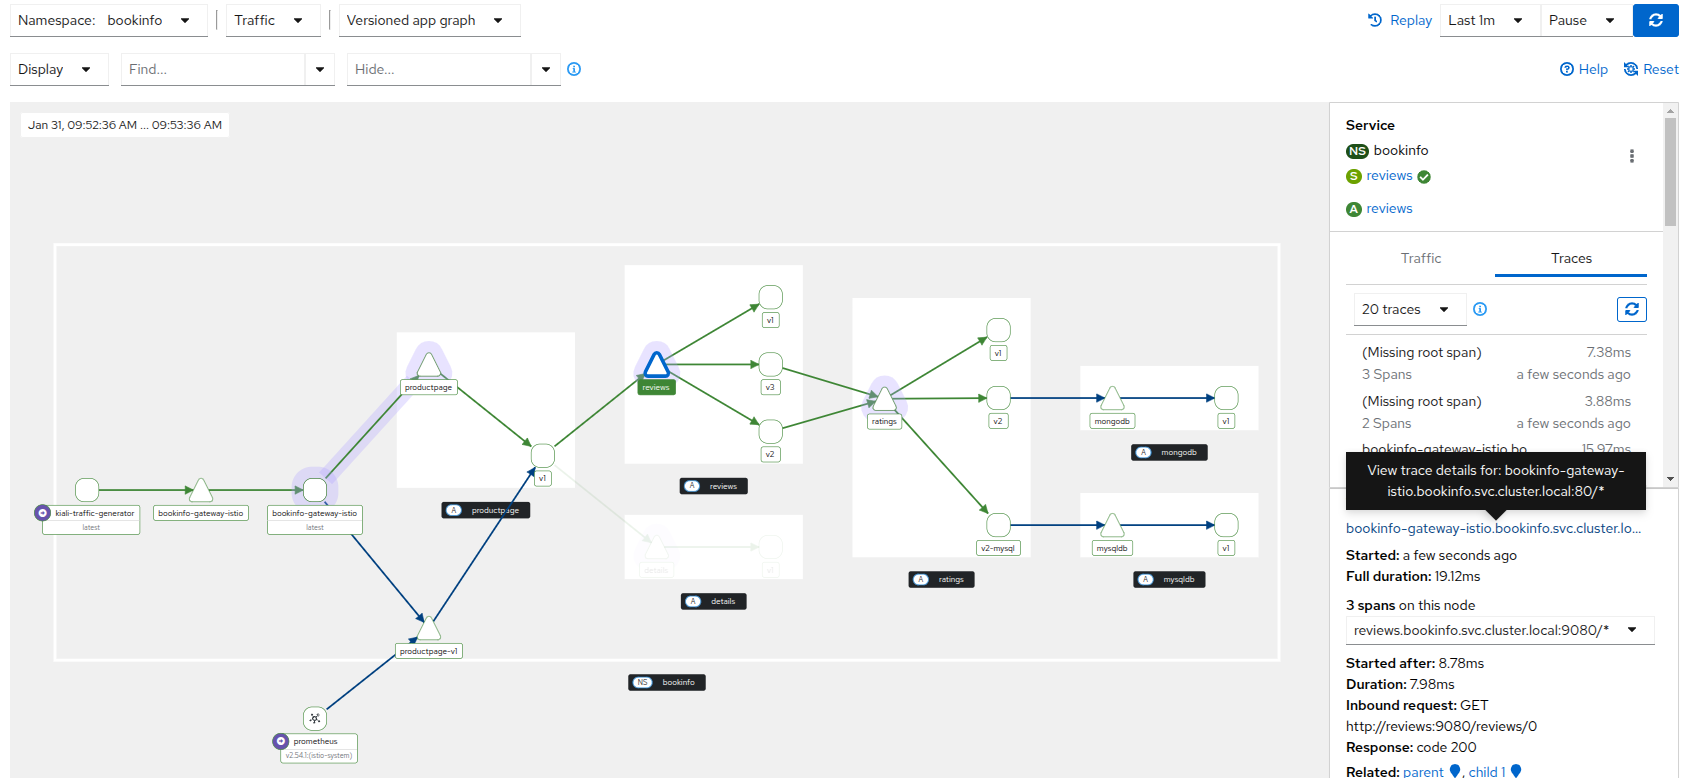
Istio Ambient Mesh
Kiali provides visualization for Ambient Mesh components:
- Control Plane Ambient Mesh
- Ambient nampespace
- Workloads in Ambient Mesh
- Waypoint proxy details
- Ztunnel details
- Ambient Telemetry
- Ambient tracing
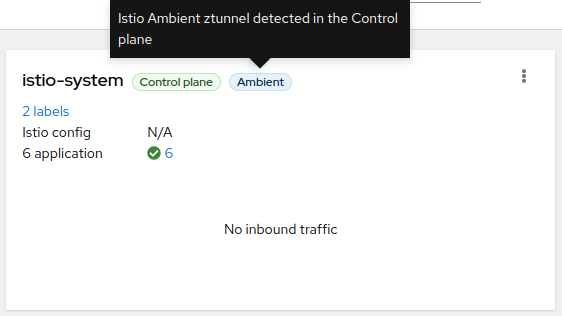
Control Plane Ambient Mesh
When the control plane is in Ambient mode, Kiali will show an Ambient badge on the Overview page control plane namespace card. It will also be reflected in the control plane side-panel on the Mesh page. This badge indicates that Kiali has detected a ztunnel (the L4 component for Ambient) in the control plane.
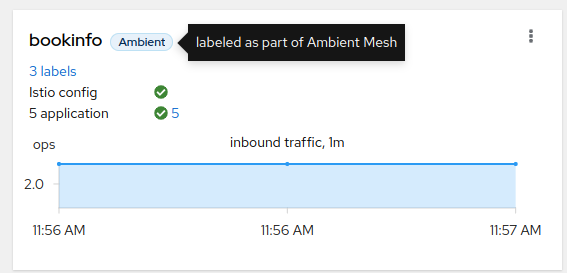
Ambient Namespace
When a namespace is labeled with istio.io/dataplane-mode=ambient it is included in Ambient Mesh, and Kiali will show the Ambient badge on that Overview page namespace card:
Workloads in Ambient Mesh
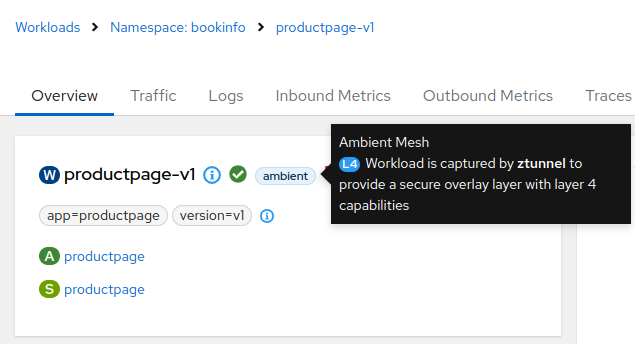
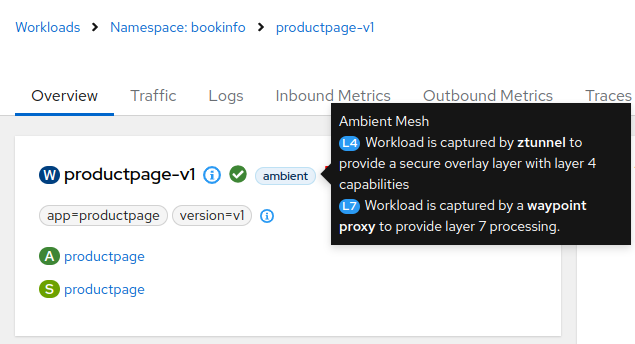
When a workload, application, or service is part of the Ambient Mesh, a badge will appear in the namespace details. When hovering over this badge, further information about the workload will be displayed:
- In Mesh: Indicating that it was included in Ambient, and the traffic is redirected to ztunnel to provide L4 features (L4 authorization and telemetry, and encrypted data transport)
- In Mesh with waypoint enabled: Additionally, it can include the L7 badge which means that a waypoint proxy is deployed (providing additional L7 capabilities):
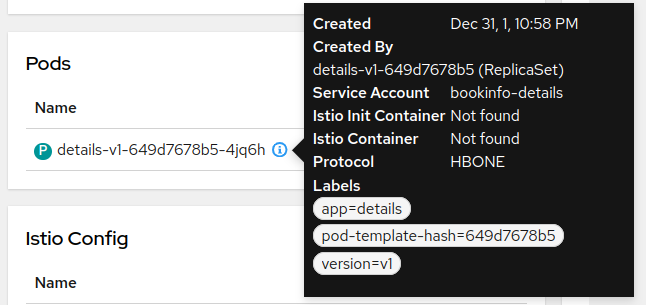
- It is possible to check each pod protocol in the information tooltip. In Ambient, instead of TCP, it uses HBONE.
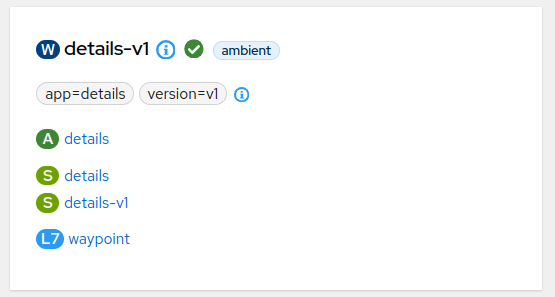
- When the workload traffic is handled by a waypoint, the workload details will show a link to the proxy:
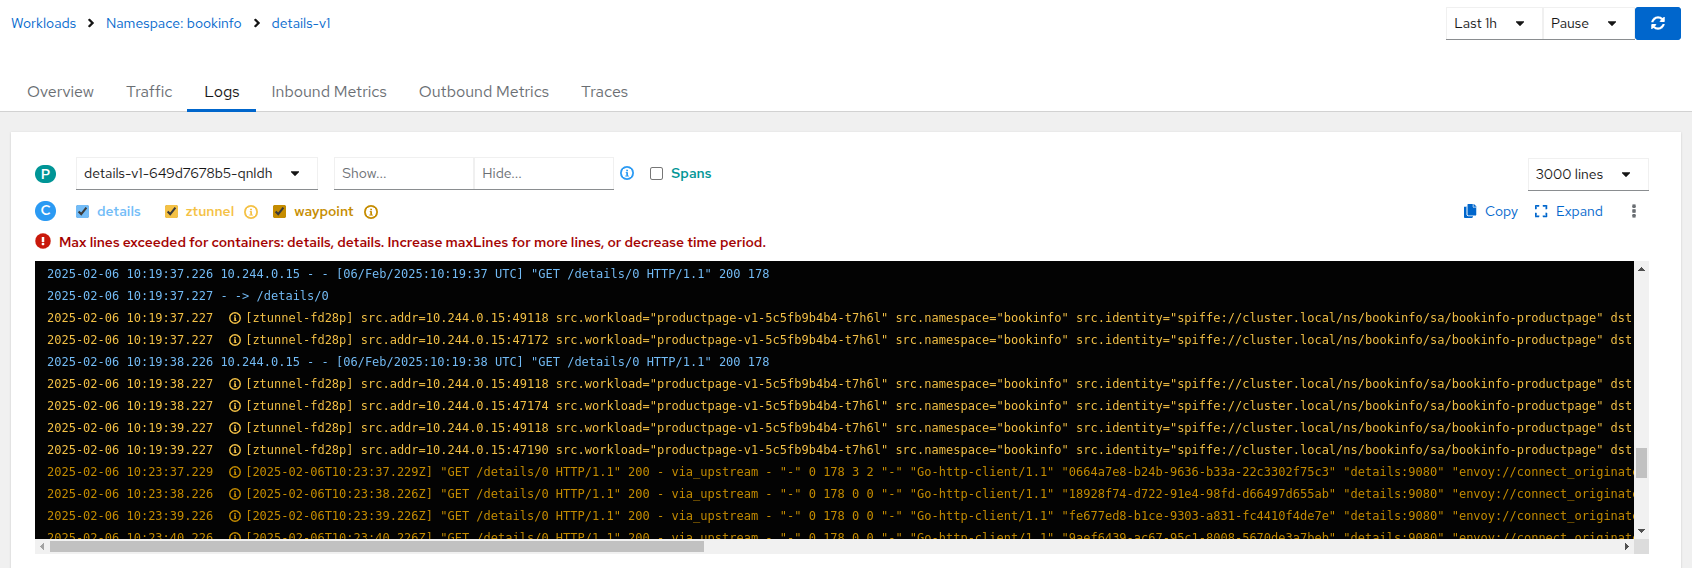
- Kiali will correlate the ztunnel and waypoint logs related to the application and provide a checkbox to include them with the application logs. This ensures that all relevant information for the application is available in one place:
Waypoint proxy details
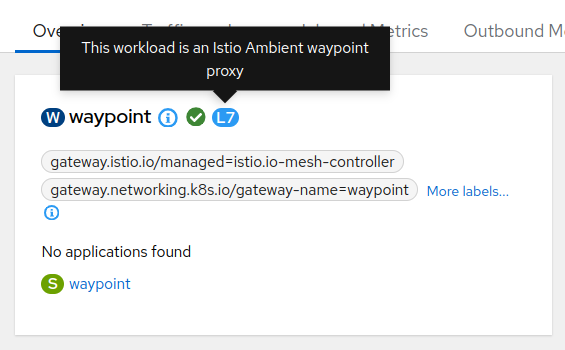
The workload details for a waypoint has specific waypoint data. It is identified with the L7 label:
The proxy status shows a new info message when some of the Discovery Services are IGNORED, and there are no other errors:

This condition is usually expected, but it is shown as an info in case it is not.
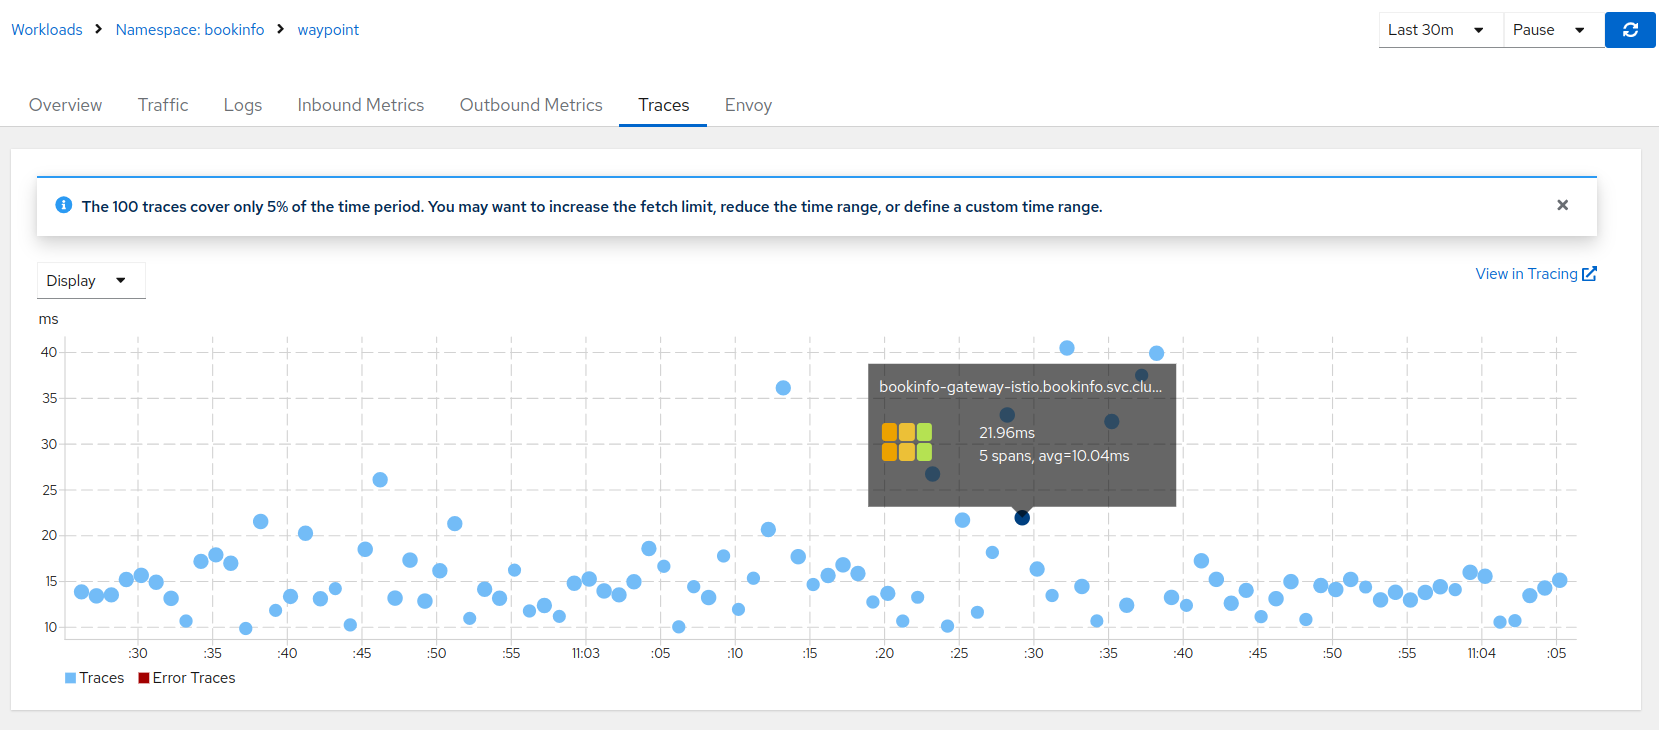
The waypoint proxy generates traces for the services for which it handles traffic, and this is where it can be checked, because the proxy generates the traces with the waypoint service name:
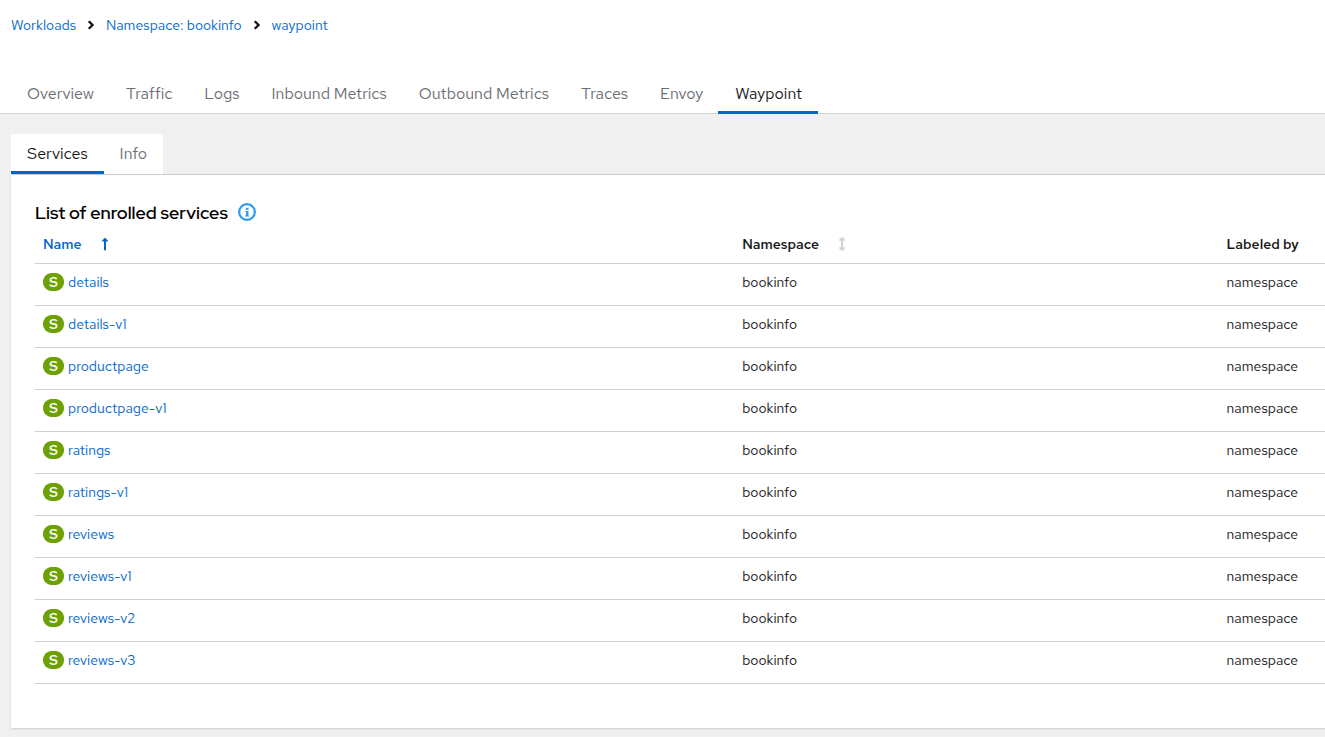
Waypoint proxies have a specific tab to show information about the Services and Workloads enrolled.
The Labeled by label identifies where the waypoint label was added. It can be in the namespace, in the service or the workload.
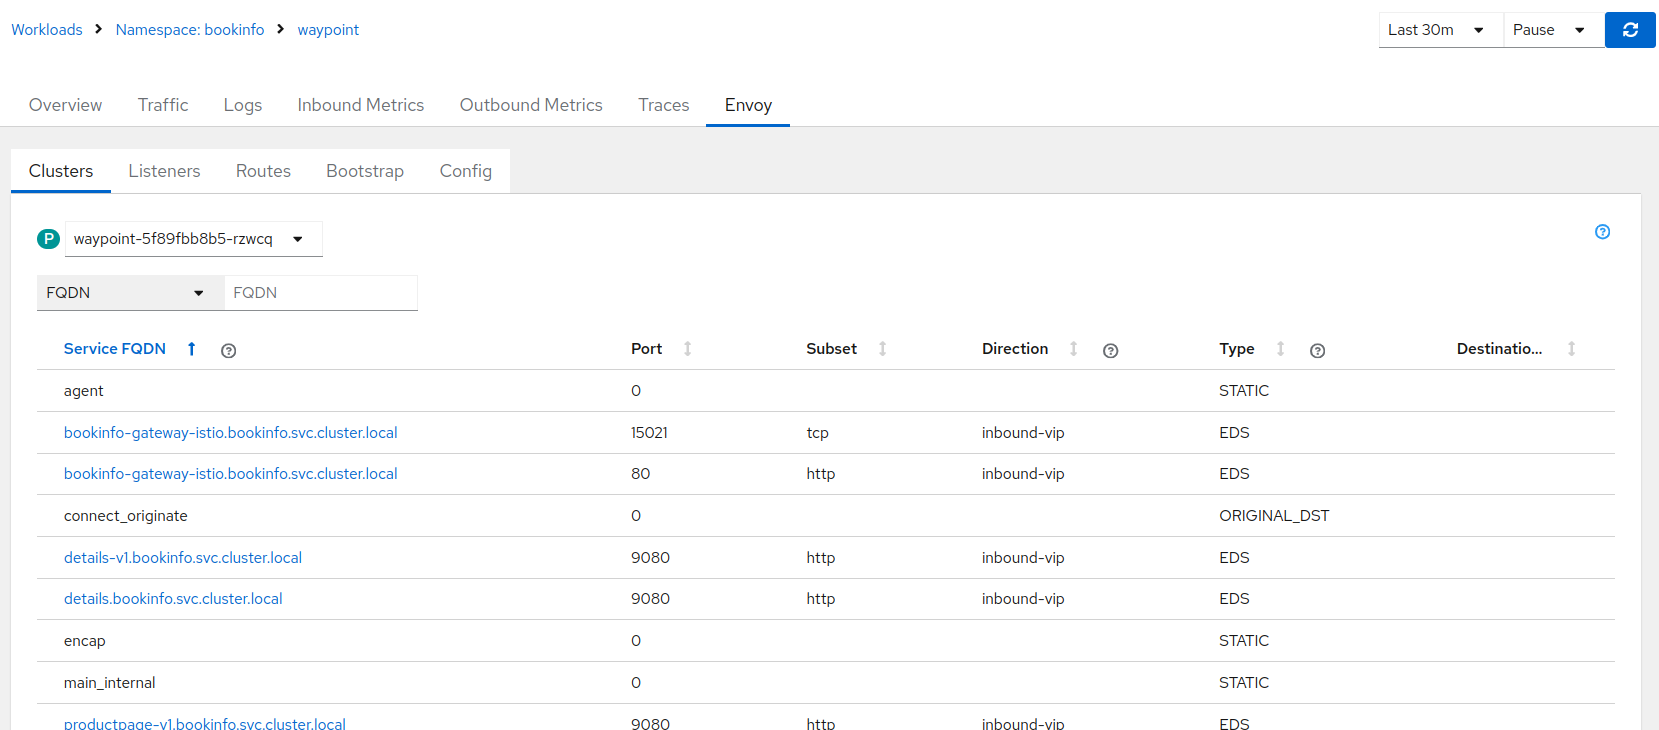
For waypoint proxies, it is also possible to see the Envoy tab:
Ztunnel details
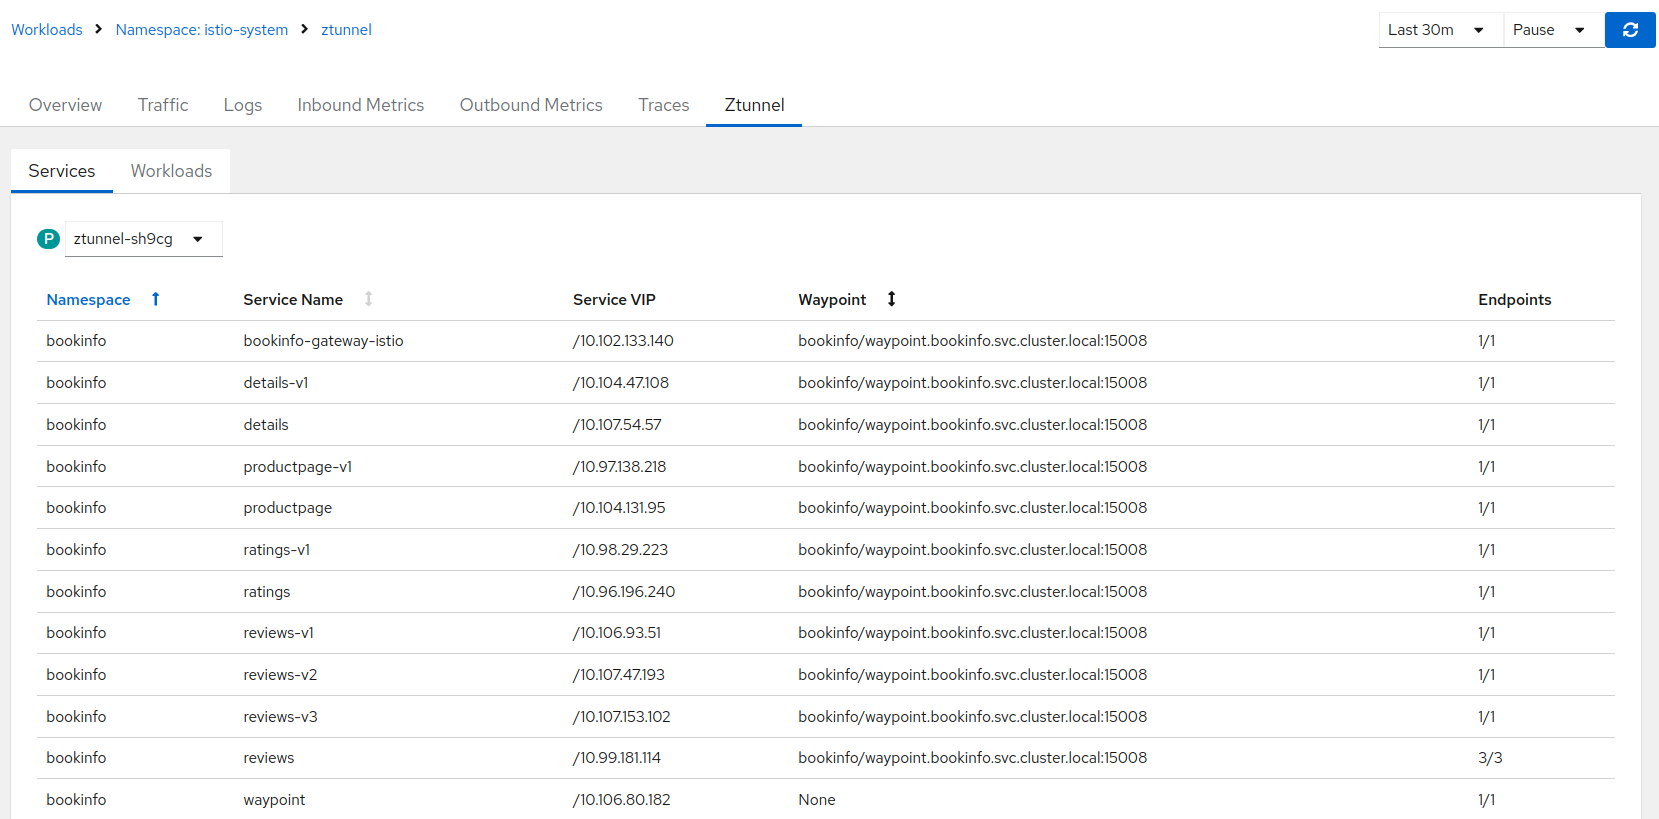
The workload details for a ztunnel workload has specific data. It has a new ztunnel tab containing the configuration for the services and workloads for which it handles traffic.
It shows the same information that can be seen using the istioctl ztunnel-config, which can be useful for troubleshooting.
Ambient Telemetry
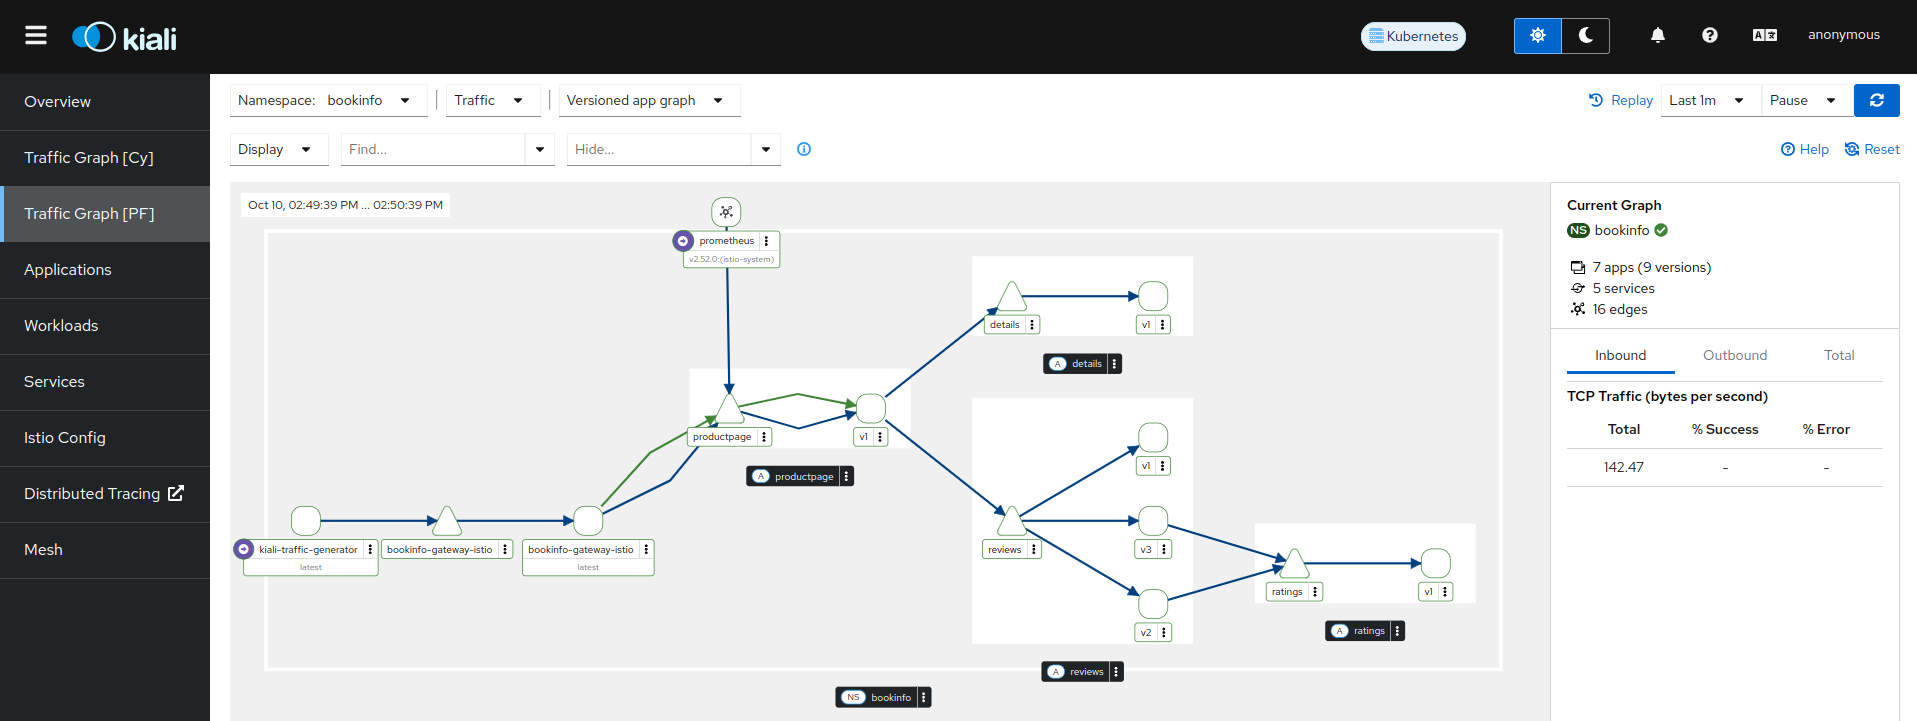
The Traffic graph generated with Ambient telemetry differs slightly from the usual graph, as the HTTP traffic and TCP traffic have different reporters.
The telemetry reported with sidecars represents the kind of traffic for the request (green edges for HTTP, blue edges for TCP). In Ambient, this information depends on the element reporting the Telemetry. The ztunnel will report all the traffic as TCP:
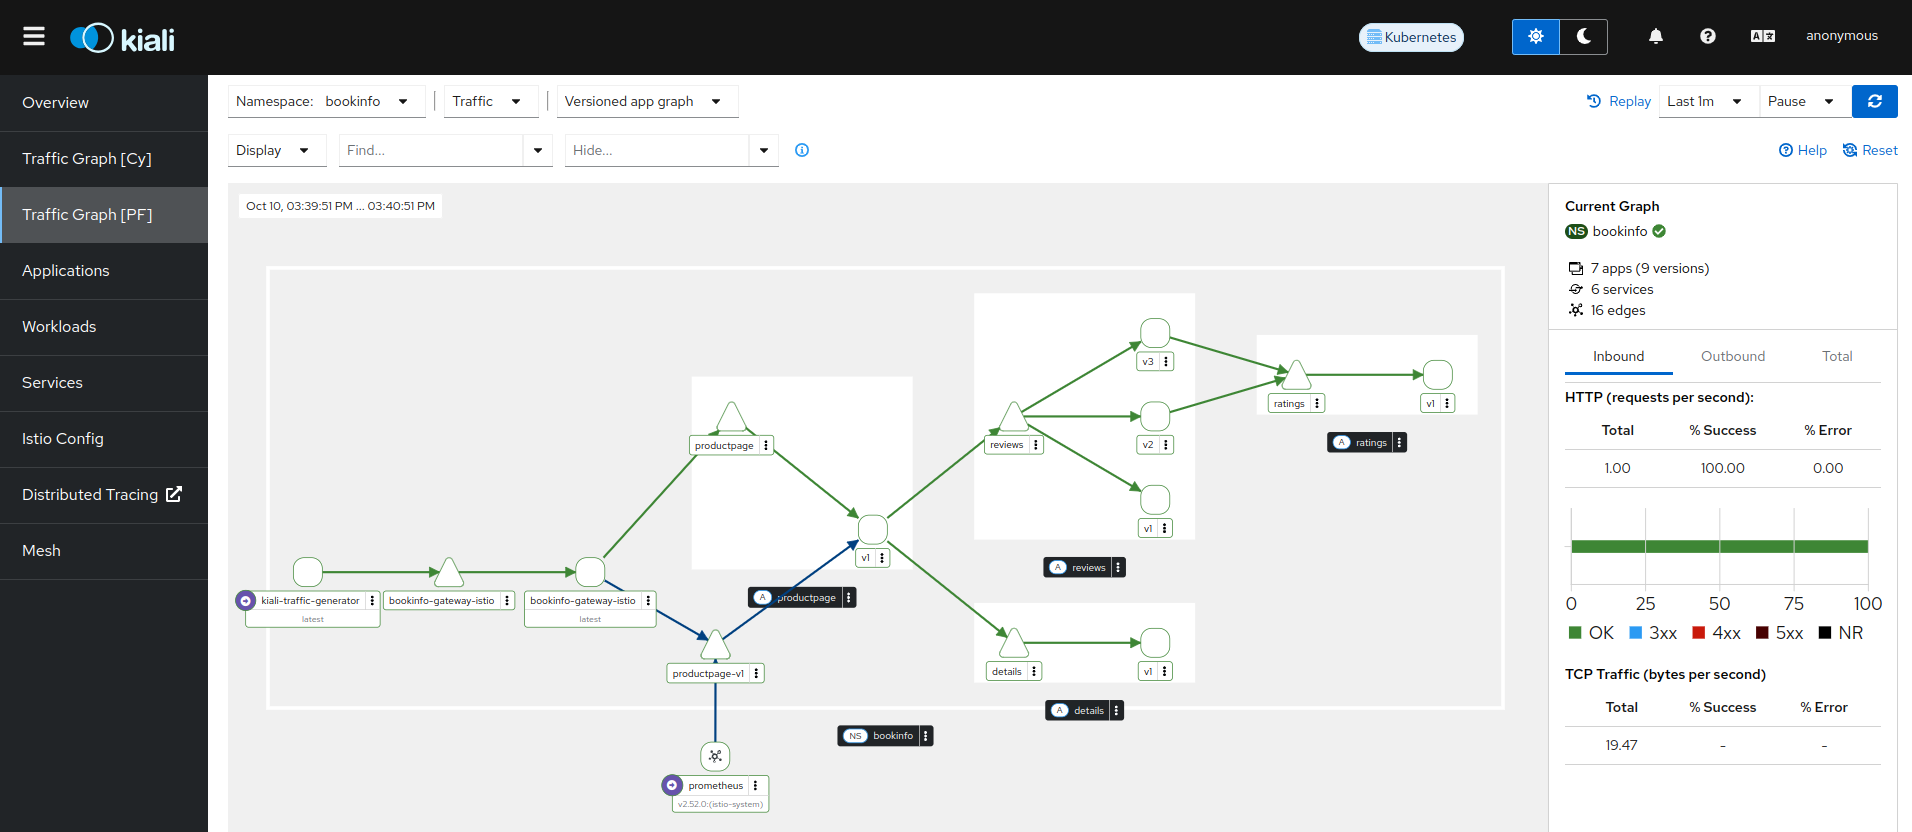
The following bookinfo namespace is in Ambient Mesh with a waypoint proxy enabled. Therefore, the telemetry is reported from ztunnel and from the waypoint, resulting in double edges connecting different nodes (Note that the Graph page toolbar offers a Traffic menu, letting you be selective about the protocols shown):
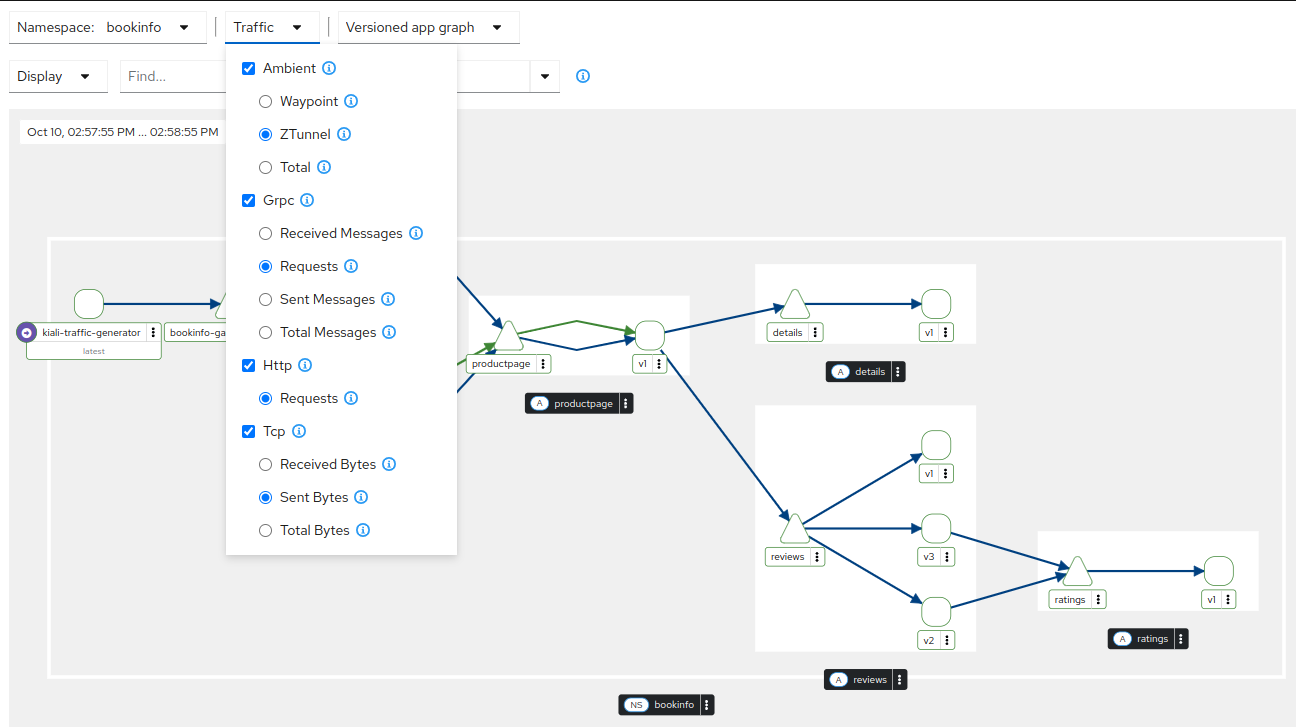
It is possible to filter the traffic by the Ambient reporter (ztunnel or waypoint) from the Traffic menu option:
There is an additional display option, waypoint proxies for the Ambient Mesh, that will display the waypoint proxies in the graph:
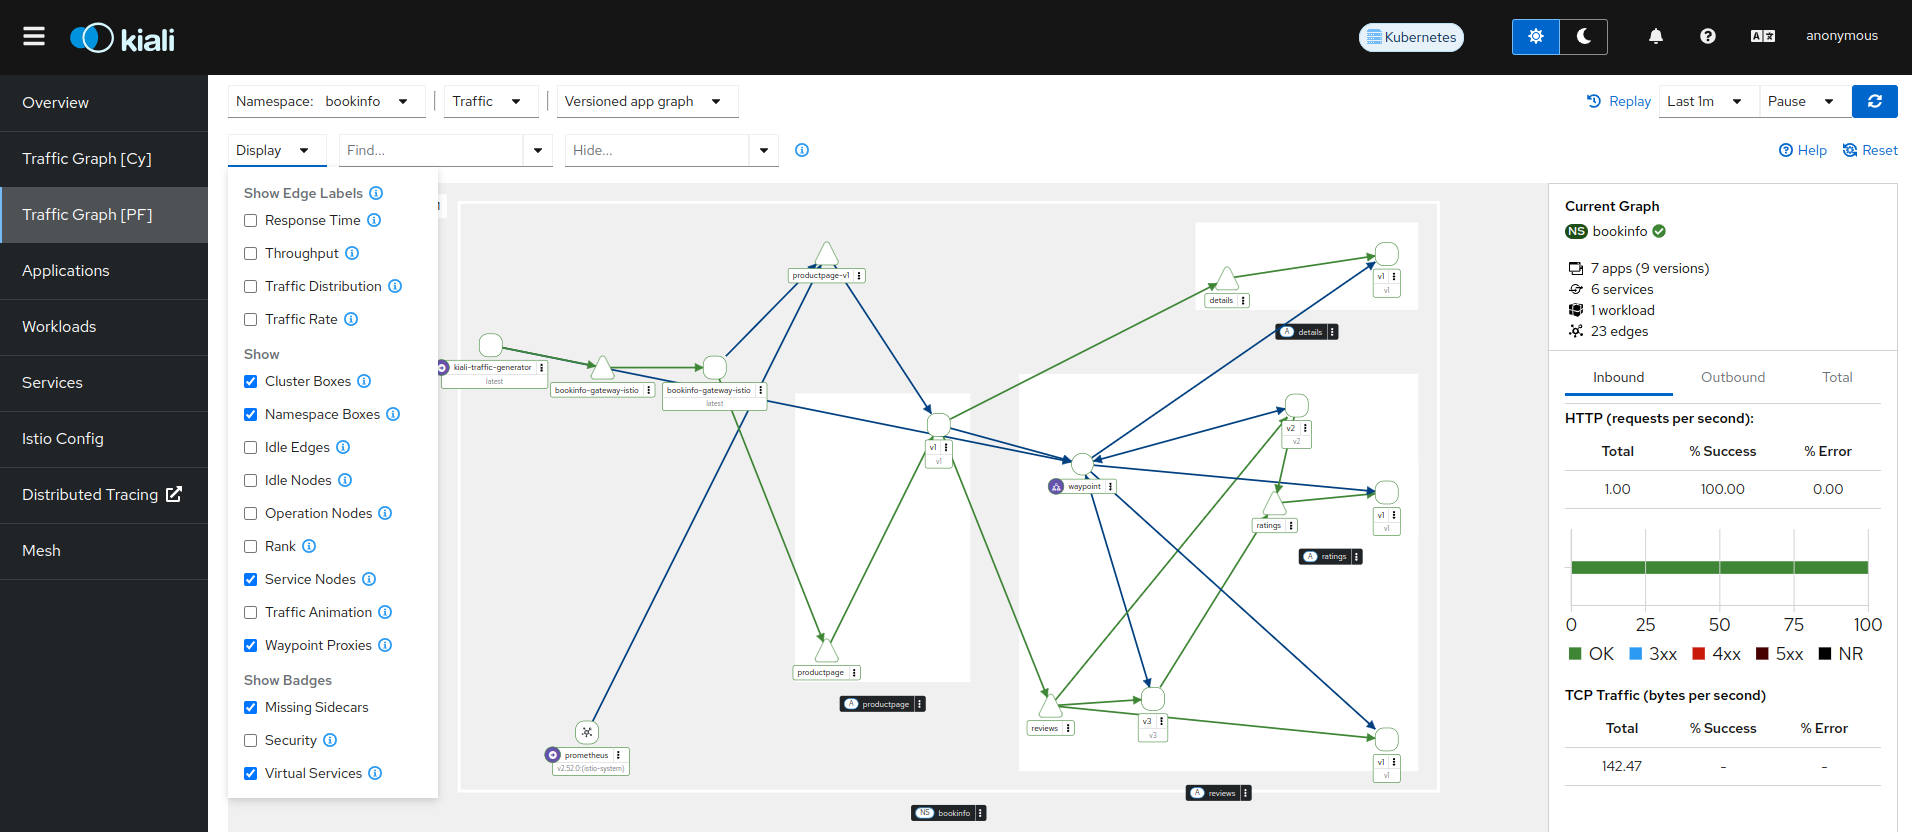
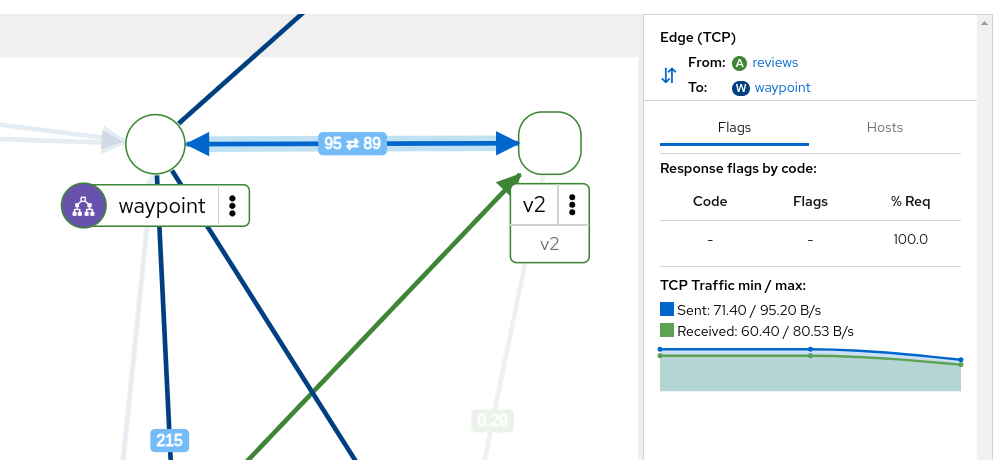
The waypoint proxies often serve as both the source and destination of traffic within the same workload, represented in the graph by bidirectional edges. When you click on an edge, the summary panel will display the waypoint proxy as the destination workload. However, you can also view the waypoint as the source by clicking on the double arrow icon located to the left of the “From/To” labels in the summary panel.
Ambient Tracing
Ambient traces are emitted from the waypoint proxies. The traces involving a workload can be found looking for the waypoint service name.
In order to correlate the waypoint traces from a specific workload, app or service, Kiali looks for traces of the waypoint proxy in which the workload is enrolled. It then filters the traces related to the application using the operation name from the span.
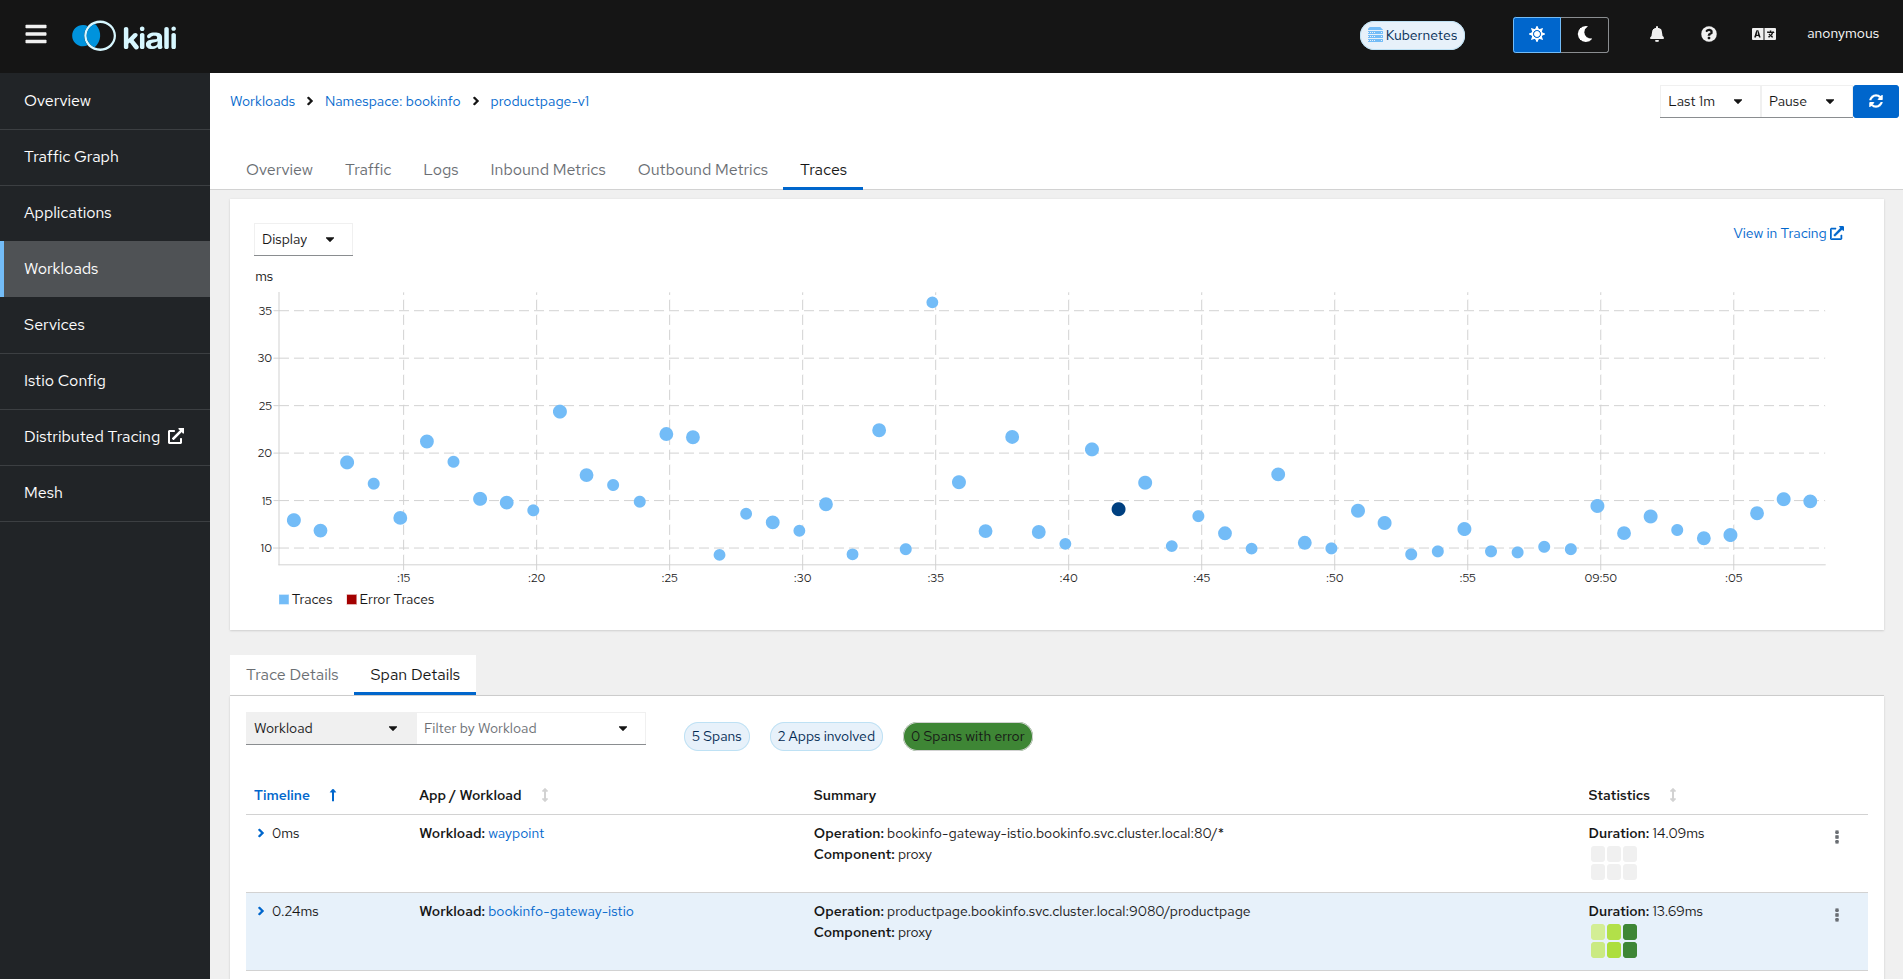
The same approach is used to show the spans in the workload logs:

Also for the inbound and outbound metrics:
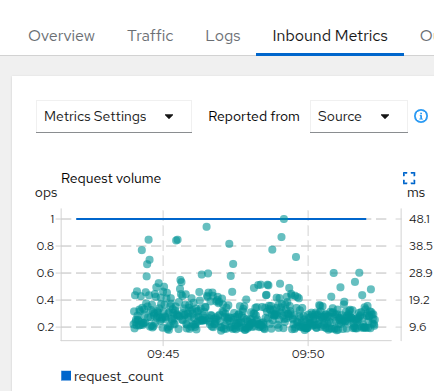
As the workload name is not part of the trace information, there are some gaps in the trace overlay (These gaps will hopefully be fixed in upstream Istio in a future Istio release - see this GitHub issue for details on that enhancement request). Also, for the workload view, there might be traces that are not part of a particular workload, but they are shown because they match the service name of the workload.
